MinPlot: A mineral formula recalculation and plotting program for electron probe microanalysis
MinPlot is a MATLAB-based mineral formula recalculation and compositional plotting program for electron probe microanalysis. The program offers recalculation and structural formula assignment for 15 different mineral groups: Garnet, pyroxene, olivine, amphibole, feldspar, mica, staurolite, cordierite, chlorite, chloritoid, talc, epidote, titanite, spinel, and sulfides. It is a fast an easy to use command line program and requires no prior computer programming knowledge! Version 1.1 can be found on GitHub, and the associated manuscript is published in Mineralogia.
|
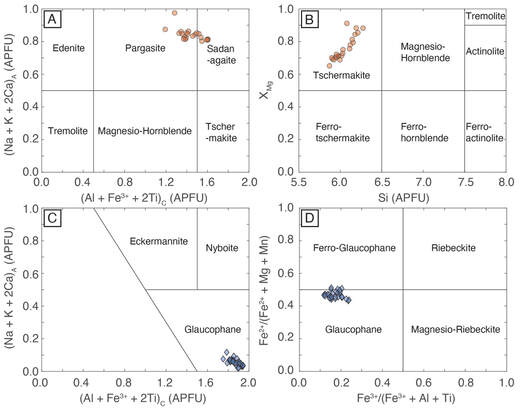
Clinoamphibole compositional and classification diagrams (left) : (A) (Al + Fe3+ + 2Ti)C vs (Na + K + 2Ca)A diagram for Ca-amphibole, (B) Si vs XMg diagram for Ca-Amphibole, (C) (Al + Fe3+ + 2Ti)C vs (Na + K + 2Ca)A diagram for Na-amphibole, and (D) Fe3+/(Fe3+ + Al + Ti) vs Fe2+/(Fe2+ + Mg + Mn) diagram for Na-amphibole. Analyses of glaucophane are collected on blueschists , whereas Ca-amphibole analyses are collected on zoned amphibole from a retrogressed eclogite.
|
Plotting tools for Perple_X
- Werami_plot: A Matlab code for plotting colored contours of data, such as mineral modes and compositions, from werami.
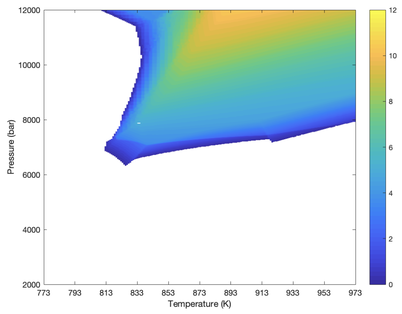
Predicted garnet modal abundances (vol %) plotted using Werami_plot.
Major and Trace Element Thermobarometry
Here are Matlab codes for major and trace element thermobarometry. Error propagation is included as specified in the file.
- Zr-in-Titanite thermometry following Thomas et al. (2010). Includes corrections for aSiO2, aCaTiSiO5, and aTiO2.
Geochemistry Tools
Here are Matlab codes for processing and plotting geochemical data.
- Rare Earth Element normalization including data plotting and calculations of Eu/Eu*
- Rare Earth Element plot with normalized REE data colored by date.
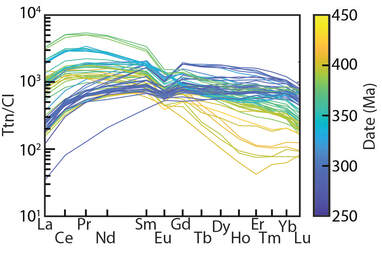
Coupled titanite CI chondrite normalized REE data and U-Pb dates (in Ma).
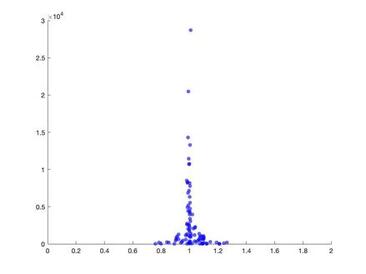
- This jitter plot function is useful for visualizing data distribution. It is particularly useful for data with a fixed lower or upper limit (e.g., limits of detection in ICP-MS) that artificially clips the true population distribution (see below example).